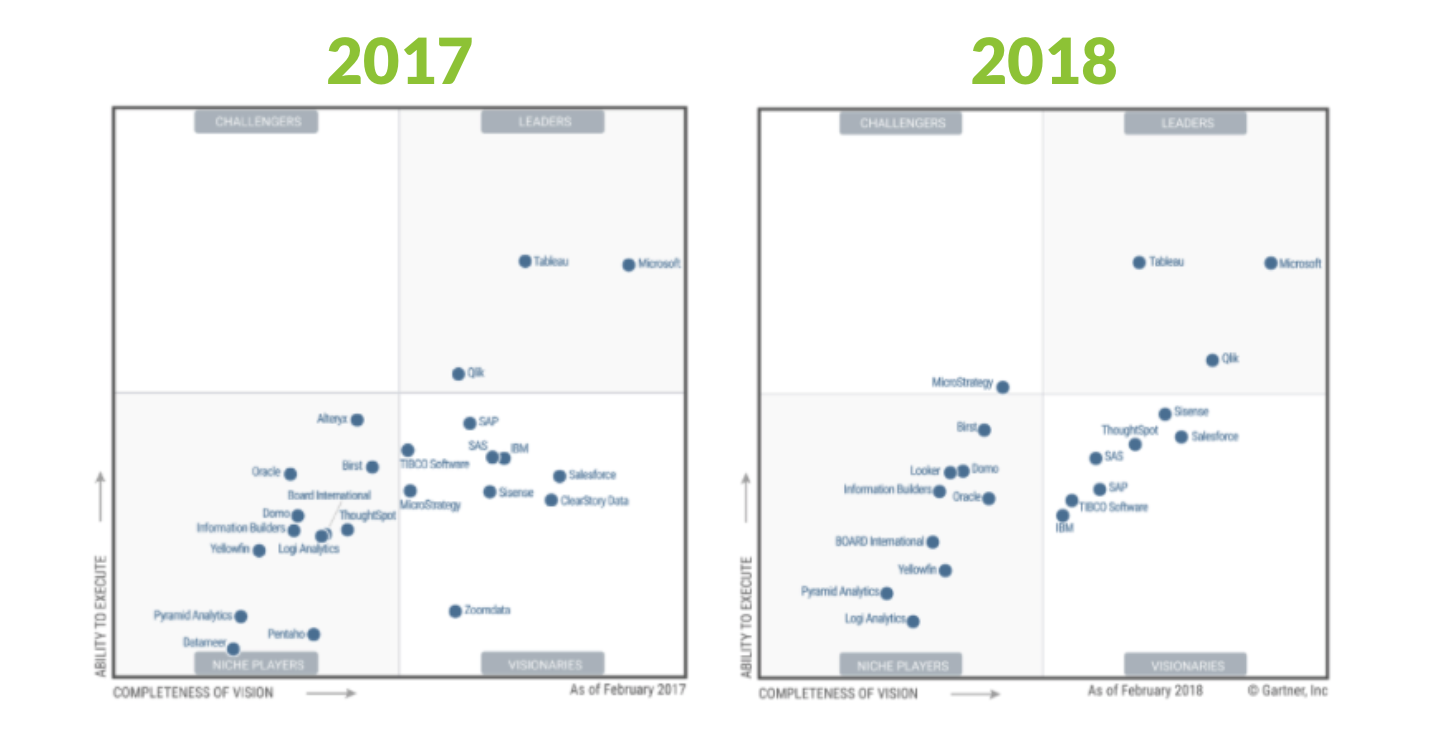
Yesterday, Gartner published the 2018 Magic Quadrant for Business Intelligence. The MQ research for BI has been in existence for close to a decade. It is THE document of reference for buyers of Business Intelligence technology.
At face value, not much seems to have changed...BUT, if you take a closer look, you'll notice that some of the biggest changes in the history of the Magic Quadrant just occurred....
Honey, I Shrunk the Kids!
For the first time in 3 years, Gartner dropped a significant amount of vendors off its quadrant. There were 24 vendors in the firm's quadrant in 2016 and 2017. This year, the Magic Quadrant only lists 20 vendors...that's a 16% quadrant reduction. Has the market shrunk?!
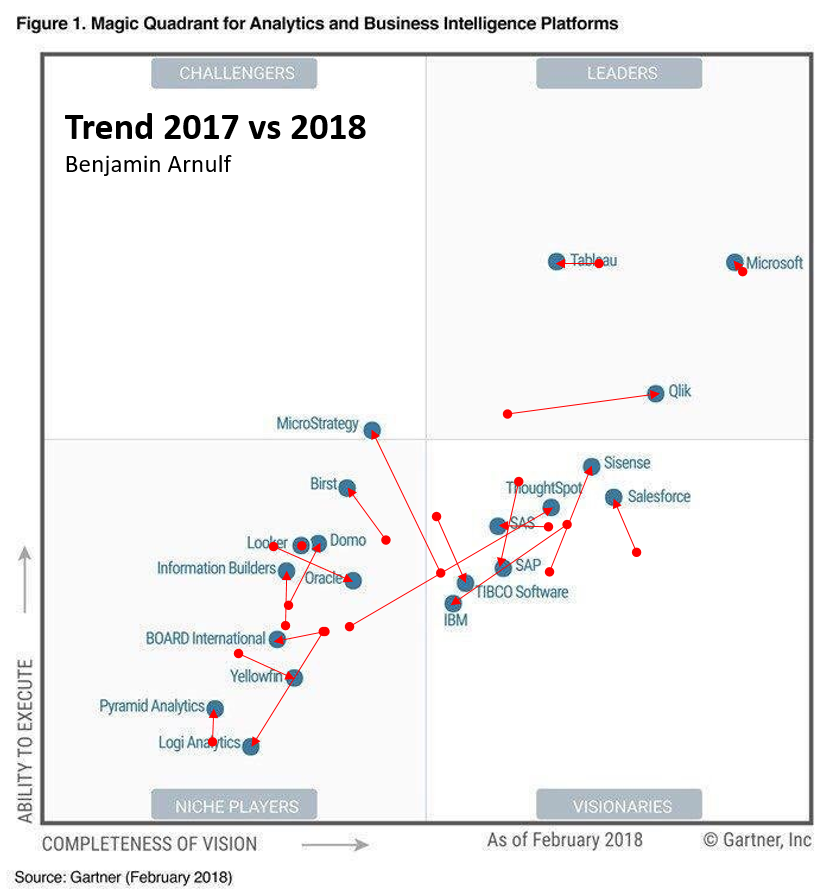
Not exactly: the market has evolved....and in a pretty predictable way actually. Take a look at our 3-year-movement analysis table below: we see a pretty consistent story, e.g. the big are getting bigger, some of the visionaries got absorbed (or disappeared) and few 'trend-setters' graduated up. More precisely:
- The same 3 vendors made the Leaders box this year as they did for the last 3 years: Microsoft (NASDAQ: MSFT), Tableau (NASDAQ: DATA) and Qliktech. If you're wondering why Qliktech made a dramatic 'visionary' jump after being acquired by private equity firm Thoma Bravo in 2016 and losing their CEO in 2017, this might be a good webinar to join....
- Out of the Quadrant this year: Alteryx, ClearStory Data, ZoomData, Datameer and Pentaho. Oracle, which had been taken out of the quadrant in 2016 and got resurrected in 2017, is still in the Niche box...
- New in 2018: MicroStrategy (NASDAQ: MSTR) is a Challenger. Huh?! The Challenger box was empty in 2016 and 2017. What has changed this year? Is this because MicroStrategy announced that they were opening their semantic layer to the rest of the BI tools? Is Gartner seeing this move as a force that could potentially challenge the industry in a new direction?!
You might still have some open questions about this quadrant. That's why Jen Underwood and I will be hosting a webinar next week to dissect this quadrant in details for you. Register here or by clicking the below button.
Are You Getting Value?!
You'll find copies of the Magic Quadrant on some of the vendors' sites and we're sure your team is looking forward to going through the 60+ page-document. But, before they do so, we suggest they direct their attention to some of the "planning assumptions" highlighted on the document's first page. In particular:
- By 2020, the number of users of modern business intelligence and analytics platforms that are differentiated by augmented data discovery capabilities will grow at twice the rate — and deliver twice the business value — of those that are not.
- By 2020, organizations that offer users access to a curated catalog of internal and external data will derive twice as much business value from analytics investments as those that do not.
We believe Gartner is on to an important theme here: Business Intelligence is about Business Value. "Self-service BI", the trend that drove the industry’s 60% YOY growth in 2015 created some unintended consequences: enterprises bought a lot of BI tools. Some brought value. Some did not. The consequence: in 2017, the market grew by only an estimated 10% and Gartner now expects it to grow at 8% through 2021.
- This doesn't mean the opportunity for "data democratization" is shrinking: the industry's adoption numbers are still in the low 30%.
- It means however that growth is slowing down: in the report, Gartner refers to "saturation" and "pricing pressure".
- We believe that the industry is hitting a saturation point with its current approach. And we know this because, in a market that's slowing down, players are forced to compete on cost in order to grow. When business value can't be proven, cost-savings conversations take the lead. We need to get back to value!
Want to know how to do that? Join the webinar that Jen Underwood and I are hosting next week: she's prepared a great 'checklist' that will help you get back on the value track.
What Gartner might not be telling you...
This Magic Quadrant was supposed to be published on Feb 16 according to Gartner's site. We can only guess that the reason why it took a few extra weeks is because of some of the radical new changes that occured in this year's edition.
Some of the tech industry largest players are omitted from this year's report: Google (NASDAQ: GOOGL) and Amazon (NASDAQ: AMZN) are starting to build a growing influence in the space. They both have visualization capabilities. They surprisingly only get a few mentions throughout the report: Amazon is mentioned 8 times. Google is only mentioned 4 times...
What else?!
It's difficult to point to the past three years and predict exactly what the next three years will look like. However, we hope that our 3-year-movement analysis table will help you make more sensible choices for your organization. In addition to the table, here are a few additional considerations:
- Self-service BI has shaken the industry and has resulted in several unintended consequences. Business units have bought all the tools they could buy, and now I.T departments have to bring order to their BI chaos. Modern Business Intelligence approaches include a "Universal Semantic Layer".
- Data Lakes have become ubiquitous. The average Chief Information Officer spends close to $20M a year to orchestrate Big Data analytics workloads across traditional data warehouses like Teradata, modern data platforms like Hadoop and next-generation serverless technologies like Google BigQuery. As a result, the data platform ecosystem has become more complex, not less.
- The Cloud, as highlighted in our last Big Data Maturity survey, will drive 72% of enterprise CIOs to modernize their enterprise data architecture and economically scale their deployments. This will bring great benefits to the enterprise but it will also result in a mixed on-premise and cloud environment which will create more headache for IT and business users alike.
We can't wait to hear the questions you'll have for us at our "MQ demystification" webinar. Register here (or below) and don't hesitate to put in the comments section the questions you'd like us to address!
.jpg)


